How to use the Fineprint Viewer
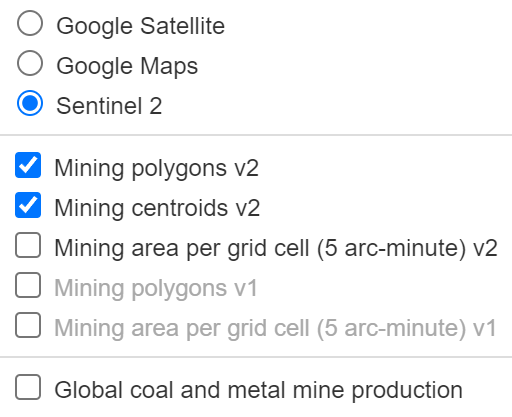
The Fineprint viewer displays different geospatial layers of information on global mining activities and satellite images. Layers can be visualised by (un)checking the boxes on the bottom right.

The first five boxes display different information derived from datasets of global mining polygons, covering the land area occupied by mine sites around the globe. Of these layers, the first three layers (Mining polygons v2, Mining centroids v2, Mining area per grid cell v2) are based on data from the 2022 version of this dataset, and layers four and five (Mining polygons v1, Mining area per grid cell v1) are based on the previous 2020 version of this dataset. It is advised to use the first three layers (v2), as more mining area globally is covered.
The sixth box (Global coal and metal mine production) displays the location of mines included in the open database on global coal and metal mine production, where data on more than 1100 mines globally was gathered from mining company reports. For these mines, information such as mine name, owner, commodity and production is usually available. Note that this layer is independent from the five layers above.
Layer “Mining polygons v2” and “Mining centroids v2”
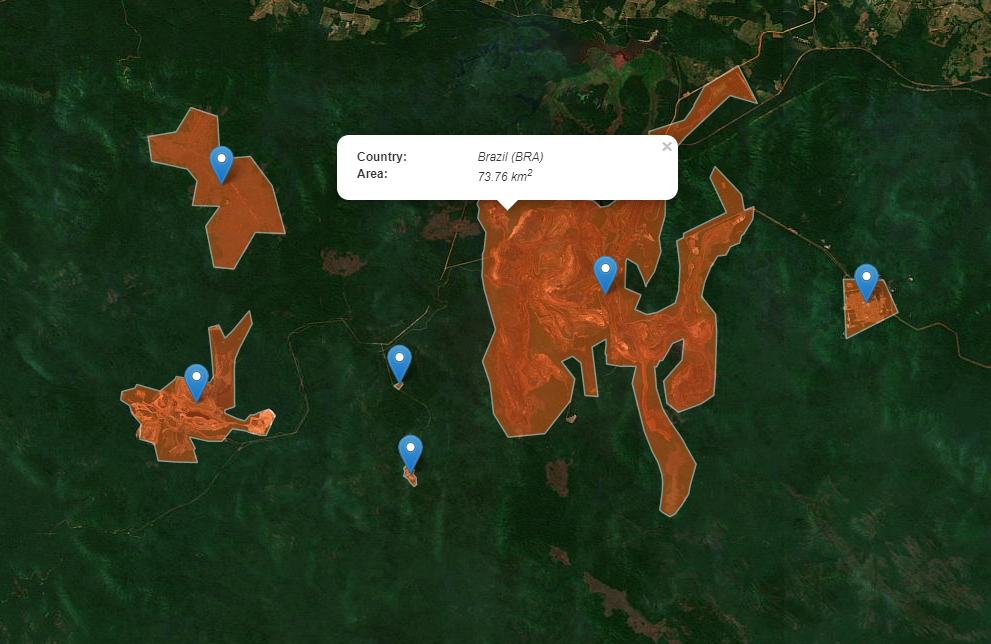
Mining Polygons shows polygons containing mining areas. Blue markers indicate the centroids of the polygons. By clicking on the polygon or the blue marker, the country and the area of the polygon is displayed.

Layer “Mining area per grid cell v2”
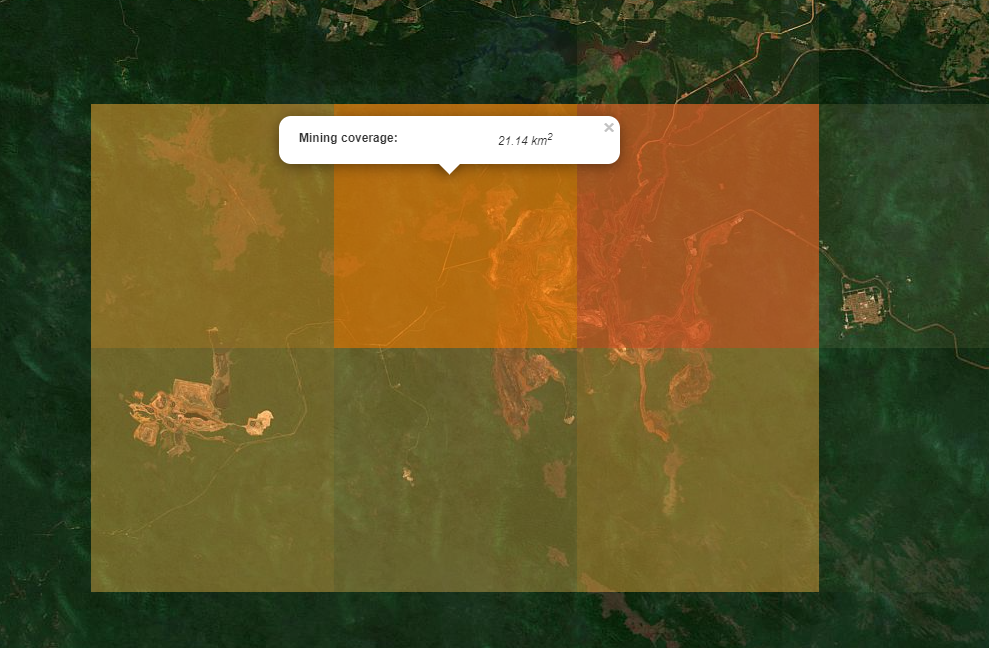
This layer overlays the map with 5 arc-minute grid cells, colored according to the mining area in each grid cell. By clicking on one cell, the mining area in this grid cell is displayed.

Layer “Global coal and metal mine production”
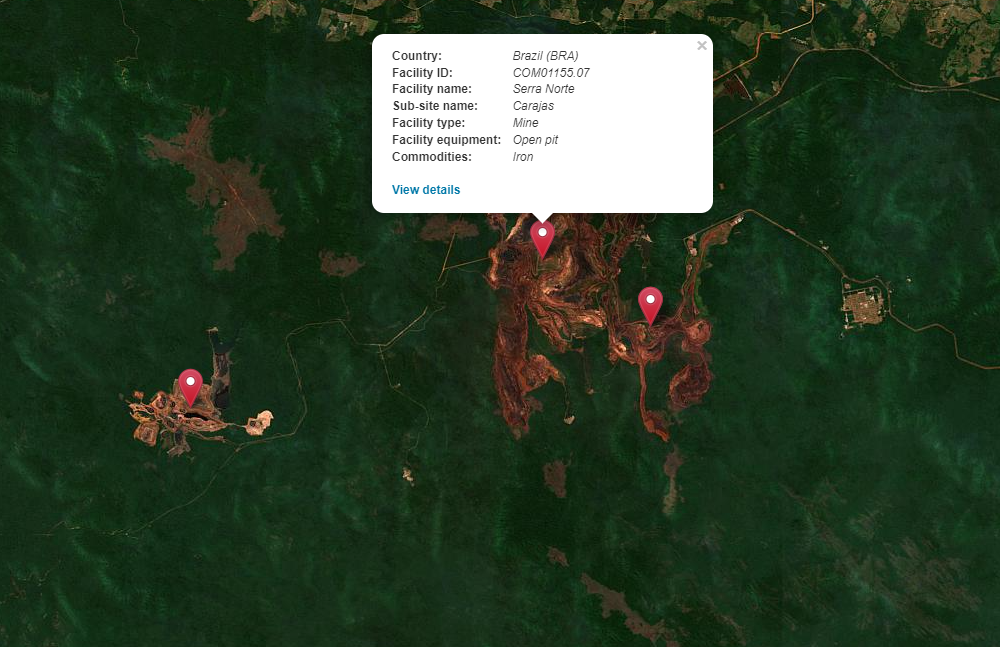
The layer “Database on global coal and metal mine production” shows mines included in the open database on global coal and metal mine production. By clicking on one of the red markers, more information about the mine, including the name of the mine, is shown. By clicking on “View details”, potential mine production is visualised in a separate tab.
Please note that this layer is independent from the other layers. Often, red markers overlap with mining polygons, but this does not imply whether, and to what extent the mining area indicated by the polygon corresponds to the mine given by the red marker.


